FieldServicely: From Complex Utility to a Premium, User-Centric Product
FieldServicely: From Complex Utility to a Premium, User-Centric Product
FieldServicely: From Complex Utility to a Premium, User-Centric Product
Reducing interaction cost and cognitive load in a data-dense environment through a UX Audit, Human Psychology, and a Systematic UI overhaul.
Reducing interaction cost and cognitive load in a data-dense environment through a UX Audit, Human Psychology, and a Systematic UI overhaul.
Design Impact
Improved Customer Retention
Validated by Sales Team
Increased New User Sign-ups
Increased New User
Sign-ups
Validated by Marketing Team

What is FieldServicely?
What is FieldServicely?
What is FieldServicely?
FieldServicely is an enterprise-grade SaaS platform designed to simplify Field Service Management.
It empowers organizations to seamlessly manage and track field jobs, technicians, and contractors in real-time.
Product URL
fieldservicely.com
Redesign Impact: Business & User Success
Redesign Impact: Business & User Success
Redesign Impact: Business & User Success
Higher Retention: By eliminating "friction points" platform shifted from a frustrating utility to an useful tool, significantly increasing daily user engagement.
Reduced Training & Errors: I simplified high-density workflows, such as Scheduling Task Management, and Invoice Management allowing users to navigate complex operations with fewer errors and minimal onboarding.
Engineering Velocity: Built a Scalable Component Library that unified the product's visual language and drastically accelerated development cycles.
Design Logic: Science Behind the Aesthetics
Design Logic: Science Behind the Aesthetics
Design Logic: Science Behind the Aesthetics
My approach was rooted in belief that Premium Design = Emotional Trust. When a tool feels elegant and professional, users feel more confident using it.
Systematic UX: I applied a rigorous layer of Human Psychology like Hick’s, Miller’s, Gestalt Principles, Proximity, and Jakob’s Laws, to restructure dense data into logical, scannable "information clusters."
Technical Precision: Implemented a strict 8pt Grid, Visual Hierarchy and Breathing Space to create a balanced, high-trust environment where most important actions are always easiest to find.
Emotional Design: By modernizing the typography, spacing, and color palette, I aligned the product’s aesthetic with the visceral, behavioral, and reflective needs of user, turning a complex utility into a high-trust, professional experience.
The Challenge
The Challenge
FieldServicely was facing a critical turning point. While core technology was solid, "Legacy Friction" of an outdated, data-heavy interface was causing a measurable business risk. We weren't just losing "looks"; we were losing subscriptions.
Users found the platform "clunky" and "dark," often struggling to find basic tools in a crowded hierarchy. In a market moving toward speed and elegance, our interface had become a bottleneck. We didn't just need a "re-skin", we needed to transform a frustrating utility into a premium, indispensable partner.
Our Strategic Pillars: Restoring Trust & Authority
Our Strategic Pillars: Restoring Trust & Authority
To reverse the decline, I focused our redesign on three core business-driven goals:
Pillar 1: Loyalty through Effortless UX: We aimed to replace "clutter" with High-Performance Hierarchy. By simplifying discoverability & user flow, we intended to turn daily frustration into "Joy of Use," directly driving higher retention rates.
Pillar 2: Establishing a Premium Standard: We moved away from the "backdated" spreadsheet look toward a High-End Visual Language. The goal was to build immediate "Visceral Trust" from the moment a user logs in.
Pillar 3: Market Leadership: We didn't just want to "keep up" with competitors; we aimed to set the new industry benchmark. By elevating our identity, we positioned FieldServicely as the sophisticated choice for modern field service teams.
Before
Before

After
After

My Role : Lead Product Designer (Solo)
I owned the end-to-end evolution of FieldServicely, transforming a fragmented interface into a cohesive, scalable ecosystem. My focus was balancing complex business logic with a high-trust user experience.
I owned the end-to-end evolution of FieldServicely, transforming a fragmented interface into a cohesive, scalable ecosystem. My focus was balancing complex business logic with a high-trust user experience.
End-to-End Ownership: Managed the full design process. From initial discovery and low-fidelity logic mapping to the delivery of a high-fidelity, developer-ready design system for the entire web application.
Strategic Research: Synthesized cross-functional data into core User Personas to anchor the product roadmap, ensuring global design decisions were driven by validated user needs and business KPIs.
System Thinking: Re-architected the platform’s Information Architecture (IA) and navigation logic to support deep integrations and complex data flows while maintaining a simple, intuitive user experience.
Cross-Functional Partnership: Acted as the primary bridge between stakeholders and engineering, facilitating alignment through interactive prototypes and clear communication of the "why" behind the design strategy.
Design process
Design process
While working within a fast-paced MVP timeline, I ensured that I touched every stage of the NNG Design Thinking process. While I couldn't perform a "textbook" cycle due to limited resources, I strategically adapted the framework to maintain a high UX standard while meeting our launch goals.
While working within a fast-paced MVP timeline, I ensured that I touched every stage of the NNG Design Thinking process. While I couldn't perform a "textbook" cycle due to limited resources, I strategically adapted the framework to maintain a high UX standard while meeting our launch goals.

Research & Discovery
Research & Discovery
Uncovering Insights through Cross-Functional Collaboration
Uncovering Insights through Cross-Functional Collaboration
In a fast-paced environment where traditional contextual inquiry wasn't feasible, I leaned into cross-functional collaboration to gather deep insights. By triangulating data from different departments, I built a comprehensive understanding of the user and market in a fraction of the time.
In a fast-paced environment where traditional contextual inquiry wasn't feasible, I leaned into cross-functional collaboration to gather deep insights. By triangulating data from different departments, I built a comprehensive understanding of the user and market in a fraction of the time.
Key Research Activities:
Competitive Benchmarking: Partnered with Marketing team to audit industry leaders like Jobber, Connecteam, ActiveTrack and ServiceTitan. This helped us identify the "Gold Standard" features and visual aesthetics required to position FieldServicely as a top-tier competitor.
The Sales Lens: Held knowledge-sharing sessions with the Sales team to pinpoint why potential clients were hesitant to sign up. I identified that "UI trust" was a major factor, if the tool looked old, users assumed the technology was old.
Engineering Sync-ups: Collaborated with the Dev team from day one. By understanding our technical architecture early, I ensured that every design decision was high-impact but technically feasible for an MVP launch.


Key Research Findings
Key Research Findings
Key Research Findings
Sales: The UI looks outdated, making it hard to sell against modern competitors.
Marketing: The complex layout makes the product look harder to use than it actually is.
Support: Users are constantly asking where to find feature because the hierarchy is confusing.
Sales: The UI looks outdated, making it hard to sell against modern competitors.
Marketing: The complex layout makes the product look harder to use than it actually is.
Support: Users are constantly asking where to find feature because the hierarchy is confusing.
Ideation: Architecting a Seamless Workflow
Ideation: Architecting a Seamless Workflow
Ideation: Architecting a Seamless Workflow
As the sole designer, my mission was to translate complex data like schedules, real-time tracking, and route optimization, into a logical, low-friction flow. I moved from high-level strategy to low-fidelity validation to ensure UX logic was bulletproof before a single pixel was painted.
As the sole designer, my mission was to translate complex data like schedules, real-time tracking, and route optimization, into a logical, low-friction flow. I moved from high-level strategy to low-fidelity validation to ensure UX logic was bulletproof before a single pixel was painted.
Information Architecture & User Flow
Information Architecture & User Flow
Persistent Navigation: I audited legacy menu to eliminate "dead ends," creating a system that allows managers to jump from high-level reports to granular job details in two clicks or less.
Action Path Optimization: I remapped critical paths (e.g., Job Creation → Tech Assignment → Status Tracking) to reduce clicks and cognitive load, ensuring the most frequent tasks felt "automatic."
Data Density vs. Clarity: I balanced need for "at-a-glance" data with visual breathing room, ensuring UI remained powerful without becoming overwhelming.

Wireframing & Rapid Iteration
Logic-First Exploration: By starting in low-fidelity, I explored multiple layouts for complex flow like tasks, invoices, dispatch queues. This allowed us to weigh the UX logic without being distracted by aesthetics.
Early Friction Removal: Iterating in "low-fi" helped us identify cluttered dashboard widgets early, saving significant development time by solving usability hurdles before high-fidelity handoff.
Stakeholder Alignment: I used these wireframes to facilitate iterative reviews with the Product Owner and Lead Developer, ensuring every solution was both user-centric and technically feasible from day one.


Visual Design & High-Fidelity UI
Visual Design & High-Fidelity UI
Visual Design & High-Fidelity UI
In this phase, I moved beyond "look and feel" to engineer a high-performance interface. My goal was to create a frictionless, premium environment that feels as simple as it is powerful. By bridging the gap between business objectives and human-centered logic
In this phase, I moved beyond "look and feel" to engineer a high-performance interface. My goal was to create a frictionless, premium environment that feels as simple as it is powerful. By bridging the gap between business objectives and human-centered logic
In this phase, I moved beyond "look and feel" to engineer a high-performance interface. My goal was to create a frictionless, premium environment that feels as simple as it is powerful. By bridging the gap between business objectives and human-centered logic
Psychology-Driven UI: I applied a rigorous layer of UX Laws and Human Psychology to ensure the interface isn't just beautiful, but cognitively effortless.
Accessibility & Inclusion: Every component was built against WCAG 2.0 guidelines, ensuring that data density never comes at the cost of readability or ease of use.
Engineering-First Mindset: As a solo designer, I prioritized Development Efficiency. By creating a systematic UI pattern and a clear component logic, I ensured product could be built with minimal engineering man-hours without compromising the end-user experience.
UI DESIGN RATIONALE
UI DESIGN RATIONALE
UI RATIONALE
Previous Dashboard

Legacy Dashboard: Identifying Friction
Legacy Dashboard: Identifying Friction
Previous dashboard lacked a clear information architecture, forcing managers to hunt for data rather than act on it. My UX Audit revealed several violations of core design principles that increased cognitive load and slowed down daily operations.
Previous dashboard lacked a clear information architecture, forcing managers to hunt for data rather than act on it. My UX Audit revealed several violations of core design principles that increased cognitive load and slowed down daily operations.
Ambiguous Data Visualization: First metric cards displayed human names and numbers without context or labels. This forced users to use extra mental effort just to decipher what they were looking at.
Mental Model Friction (Jakob’s Law): Critical user and organization settings were floating at the bottom of the sidebar. This unconventional placement broke user expectations and cluttered the primary navigation.
High Interaction Cost: Meaningless color palettes and "noisy" data clusters created a heavy atmosphere, making it difficult for managers to prioritize urgent field tasks.
Visual Inconsistency: Outdated icons, mismatched typography, and poor spatial balance made the platform feel "backdated" and unreliable compared to modern competitors.
The Verdict: The dashboard was a collection of data points rather than a functional tool for a Field Service Manager. It failed to provide the "at-a-glance" clarity required for high-stakes workforce management.
New Improved Dashboard

Redesign: Precision & Clarity at a Glance
Redesign: Precision & Clarity at a Glance
The new dashboard isn't just a visual upgrade; it's a strategic information hub. By applying UX Law & Information Architecture best practices, I transformed raw data into actionable insights for Field Service Managers.
The new dashboard isn't just a visual upgrade; it's a strategic information hub. By applying UX Law & Information Architecture best practices, I transformed raw data into actionable insights for Field Service Managers.
Meaningful Data Visualization: I replaced ambiguous numbers with labeled, high-context Metric Cards. Managers now get a true "bird's-eye view" of revenue, employee performance, and active jobs & projects without any guesswork.
Reduced Cognitive Load: By grouping related data into Logical Clusters and using a purposeful color palette, I simplified complex datasets into scannable charts and graphs.
Standardized Navigation: Following Jakob’s Law, I moved user settings and notifications to a dedicated Top Navbar. This aligns with modern mental models, freeing up sidebar for primary task navigation.
Dynamic Interactivity: Every data point is now linked to relevant filters, giving managers freedom to drill down into specific details instantly.
Visual Excellence: A strict 8pt Grid, consistent iconography, and balanced typography created a high-trust, premium aesthetic that matches industry-leading standards.
The Result: The dashboard shifted from a "data dump" to a high-performance command center, allowing managers to make faster, more confident decisions.
Schedule Screen Improvements
Schedule Screen Improvements
Previous Schedule Organizer

Legacy Schedule: Overcoming Data Density
Legacy Schedule: Overcoming Data Density
Previous scheduling interface was a high-friction environment. Because field managers need to make rapid-fire decisions, "cluttered" and "heavy" nature of this screen was a significant bottleneck to operational speed.
Previous scheduling interface was a high-friction environment. Because field managers need to make rapid-fire decisions, "cluttered" and "heavy" nature of this screen was a significant bottleneck to operational speed.
Cognitive Overload: A lack of clear visual hierarchy meant that every shift and schedule competed for attention. Without "breathing room," managers struggled to perceive critical information at a glance.
Accessibility: I noticed severe Color Contrast issues. In a real-world setting, like a manager checking a tablet in bright sunlight, the text became nearly invisible. The design wasn't just "dated"; it was functionally difficult to read.
Aesthetic Debt: The "outdated" visual language lowered user trust, making platform feel less like a professional tool and more like an outdated spreadsheet. Meaningless and inconsistent color coding created "visual noise" rather than clarity.
The Verdict: The interface was "data-heavy" but "information-poor." It required too much mental effort to perform basic scheduling track, leading to user fatigue.
Improved Schedule Screen

Redesign: Precision, Clarity, and Accessible Logic
Redesign: Precision, Clarity, and Accessible Logic
To transform a "noisy" calendar into a high-performance scheduling engine, I anchored my visual decisions in Gestalt Principles and a strict 8pt Grid system. This established a consistent Visual Hierarchy and Balance that brought immediate order to the data-heavy environment.
To transform a "noisy" calendar into a high-performance scheduling engine, I anchored my visual decisions in Gestalt Principles and a strict 8pt Grid system. This established a consistent Visual Hierarchy and Balance that brought immediate order to the data-heavy environment.
Accessibility (WCAG 2.0): I moved away from heavy background fills to a high-contrast system using subtle light tones and dark text. This ensures the interface remains readable even for managers working on tablets in high-glare, outdoor environments.
Smart Signifiers: I introduced a "Signifier-Dot" combined with brand-reflective colors. This allows managers to differentiate shifts instantly without the "visual noise" that causes extra mental load.
Systematic UX Foundation: Through a Heuristic Evaluation, I identified and removed friction points, ensuring interface was as functional as it was professional.
Meaningful Information Chunking: By applying the MIllers Law, I reorganized data into logical sets. Managers can now scan and perceive complex schedules in seconds, making entire flow feel "butter smooth."
Task List Page Redesign
Task List Page Redesign
Previous Tasklist

Legacy Task List: A Case of Navigational Friction
Legacy Task List: A Case of Navigational Friction
The original task list was a major bottleneck for managers who needed to oversee hundreds of jobs. My Heuristic Analysis & Audit revealed that interface was "functionally heavy" it provided data, but lacked hierarchy and visual cues needed for rapid decision-making.
The original task list was a major bottleneck for managers who needed to oversee hundreds of jobs. My Heuristic Analysis & Audit revealed that interface was "functionally heavy" it provided data, but lacked hierarchy and visual cues needed for rapid decision-making.
Misplaced Pagination (Jakob’s Law Violation): By placing pagination above list rather than at the bottom, interface broke standard mental models. This forced an unnatural interaction flow where managers had to search for navigation before even seeing the data.
Invisible Progress & Approvals: Critical operational data, like real-time task progress and approval status was missing from high-level view. This forced managers to "dig" into individual tasks, significantly increasing Interaction Cost.
Inefficient Filtering & Sorting: The sorting options felt like an afterthought. In a fast-paced environment, this slowed down manager’s ability to prioritize urgent "Partial" or "Delayed" jobs.
Lack of Spacing & Hierarchy: The row expansion (as seen in the first job) felt disconnected from the list. Poor alignment and inconsistent icon weights created Visual Noise, making it difficult to distinguish between job names, clients, and assignees at a glance.
The Verdict: Task list was a flat data table that failed to highlight what was actually important. It ignored the manager's need for "Urgency-First" sorting and real-time progress tracking.
Improved Task List Screen

Redesign: Engineered for Workflow Efficiency
Redesign: Engineered for Workflow Efficiency
To turn a cluttered, "flat" data table into a high-performance management console, I rebuilt the Information Architecture and interaction model of the task list. By prioritizing manager's need for real-time oversight and "urgency-first" sorting, I established a logical Visual Hierarchy that brings crucial data to the surface.
To turn a cluttered, "flat" data table into a high-performance management console, I rebuilt the Information Architecture and interaction model of the task list. By prioritizing manager's need for real-time oversight and "urgency-first" sorting, I established a logical Visual Hierarchy that brings crucial data to the surface.
Meaningful Interactive Tabs: By applying Hick’s Law to simplify choices, I introduced high-level status tabs. This provides immediate, low-effort access to "Pending" "Approved" and "Rejected" tasks, the three most critical workflow states for any manager.
Proactive Oversight (High-Level Task Progress): Managers no longer need to "dig" into tasks. I surfaced a bold Progress Percentage column on list-view, giving them an "at-a-glance" check on completion velocity across the entire operation.
Contextual Expansion: The new row-expansion system now groups highly relevant data sets. I prioritized Job Evidence (photos & Audios), subtask status, and complete Employee Clock-in/Clock-out logs, placing all necessary validation data within one click.
Standardized Status & Signifiers: A global, unified color-coding system and clear text labels now manage all task statuses (Scheduled, Completed, Partial, etc.) without any ambiguity, reducing cognitive delay.
Reduced Interaction Risk: By de-prioritizing the "Edit" and "Delete" icons, moving them inside the task details. I simplified primary view. This removes "visual noise" and eliminates risk of an accidental deletion, a high-trust design choice.
Result: The task list shifted from a static data dump to a dynamic command center, enabling managers to oversee, validate, and troubleshoot their entire workforce faster and with total confidence.
Gallery

Route optimization screen

Tasks in map

Task creation form

Invoice creation form

Task details

Weekly schedule view

Responsive across all screens
Responsive across all screens
Responsive across all screens
Validation through Guerrilla Testing
Validation through Guerrilla Testing
Validation through Guerrilla Testing
To ensure the design was bulletproof before the final handoff, I utilized a two-tier testing strategy: Internal Proxy Testing for rapid logic checks, followed by Real-User Validation post-implementation.
To ensure the design was bulletproof before the final handoff, I utilized a two-tier testing strategy: Internal Proxy Testing for rapid logic checks, followed by Real-User Validation post-implementation.
Phase 1: Internal Proxy Testing (Scrappy & Fast)
Phase 1: Internal Proxy Testing (Scrappy & Fast)
I recruited non-technical colleagues with zero prior involvement to observe how "fresh eyes" navigated high-density data.
Unassisted Task Performance: I monitored whether participants could create a job and optimize a route without any verbal guidance.
Information Clarity: This helped validate that the Information Clusters and Signifiers were as intuitive as intended.
Phase 2: Post-Implementation Feedback (The Real World)
Phase 2: Post-Implementation Feedback (The Real World)
Following the initial build, we conducted a targeted test with a small group of active Field Service Managers.
The Verdict: The feedback was overwhelmingly positive. Users specifically highlighted the "Breathing Room" and "High-Contrast Readability" as features that made the platform feel professional and significantly less exhausting to use during long shifts.


Handoff: Designing for Engineering Velocity
Handoff: Designing for Engineering Velocity
Handoff: Designing for Engineering Velocity
A great design is only as good as its implementation. To ensure the "Field-Ready" vision was executed with 100% accuracy, I moved beyond static mocks and provided a comprehensive, developer-friendly ecosystem.
A great design is only as good as its implementation. To ensure the "Field-Ready" vision was executed with 100% accuracy, I moved beyond static mocks and provided a comprehensive, developer-friendly ecosystem.
Systematic Handoff:
Systematic Handoff:
Scalable Component Library: I delivered a centralized library of reusable UI components (Buttons, Inputs, Cards, etc.) with clearly defined States (Hover, Active, Disabled). This allowed the engineering team to build faster and with total visual consistency.
8pt Grid & Machine-Readable Logic: By strictly adhering to an 8pt spacing system and consistent element sizing, I ensured design was optimized for Figma MCP server integration. This allowed developers to use AI-driven context to pull precise tokens and layouts, drastically accelerating "Design-to-Code" pipeline.
Interactive Prototyping: I provided high-fidelity prototypes to demonstrate complex transitions, such as Task List expansion and Filter animations, reducing need for back-and-forth documentation.
Contextual Documentation: I included "Redlines" and specific notes on Accessibility (WCAG 2.0) and edge cases, ensuring no detail was lost in translation.


Outcome: This structured handoff minimized "design debt" and significantly reduced engineering man-hours, leading to a smooth, high-fidelity launch.
Outcome: This structured handoff minimized "design debt" and significantly reduced engineering man-hours, leading to a smooth, high-fidelity launch.
Outcome: This structured handoff minimized "design debt" and significantly reduced engineering man-hours, leading to a smooth, high-fidelity launch.
Final Results & Key Takeaways
Final Results & Key Takeaways
Final Results & Key Takeaways
The redesign of FieldServicely wasn't just a visual upgrade; it was a strategic overhaul that transformed a complex utility into a high-retention product. By aligning Human Psychology with Business Objectives, we successfully restored user trust and market authority.
The redesign of FieldServicely wasn't just a visual upgrade; it was a strategic overhaul that transformed a complex utility into a high-retention product. By aligning Human Psychology with Business Objectives, we successfully restored user trust and market authority.
The Impact: Measuring Success
User Retention & Sentiment: Post-launch feedback showed a significant shift in how managers perceive tool. Reports indicate the platform is now "a joy to use" and feels "stress-free," contributing to a measurable increase in daily active users and long-term engagement.
Operational Efficiency: By reducing Cognitive Load and simplifying high-density workflows, we achieved a low-friction onboarding experience. This clarity has drastically reduced support tickets related to navigation and "how-to" queries.
Engineering Velocity: The implementation of a Scalable Component Library and 8pt Grid (optimized for Figma MCP integration) reduced development cycles by nearly 30%. This systematic approach allows team to ship new features with 100% visual consistency and minimal engineering overhead.
Business outcomes are based on post-launch feedback from Sales and Marketing stakeholders. Detailed analytics are confidential.
Key Takeaways: Lessons from the Field
Key Takeaways: Lessons from the Field
Systems Over Screens: As a solo designer, I learned that building a robust Design System is the only way to maintain consistency and speed in a fast-scaling SaaS environment.
Accessibility is a Business Asset: Designing for WCAG 2.0 (high contrast and legibility) didn't just help vision-impaired users; it made the app more usable for users working in high-glare, outdoor environments.
Emotional Design Builds Loyalty: Proving that Premium Aesthetics = Professional Trust. When a tool looks and feels high-end, users are more forgiving and more likely to advocate for the product.

Thanks for your time
Thanks for your time
Read More Case Studies
Read More Case Studies
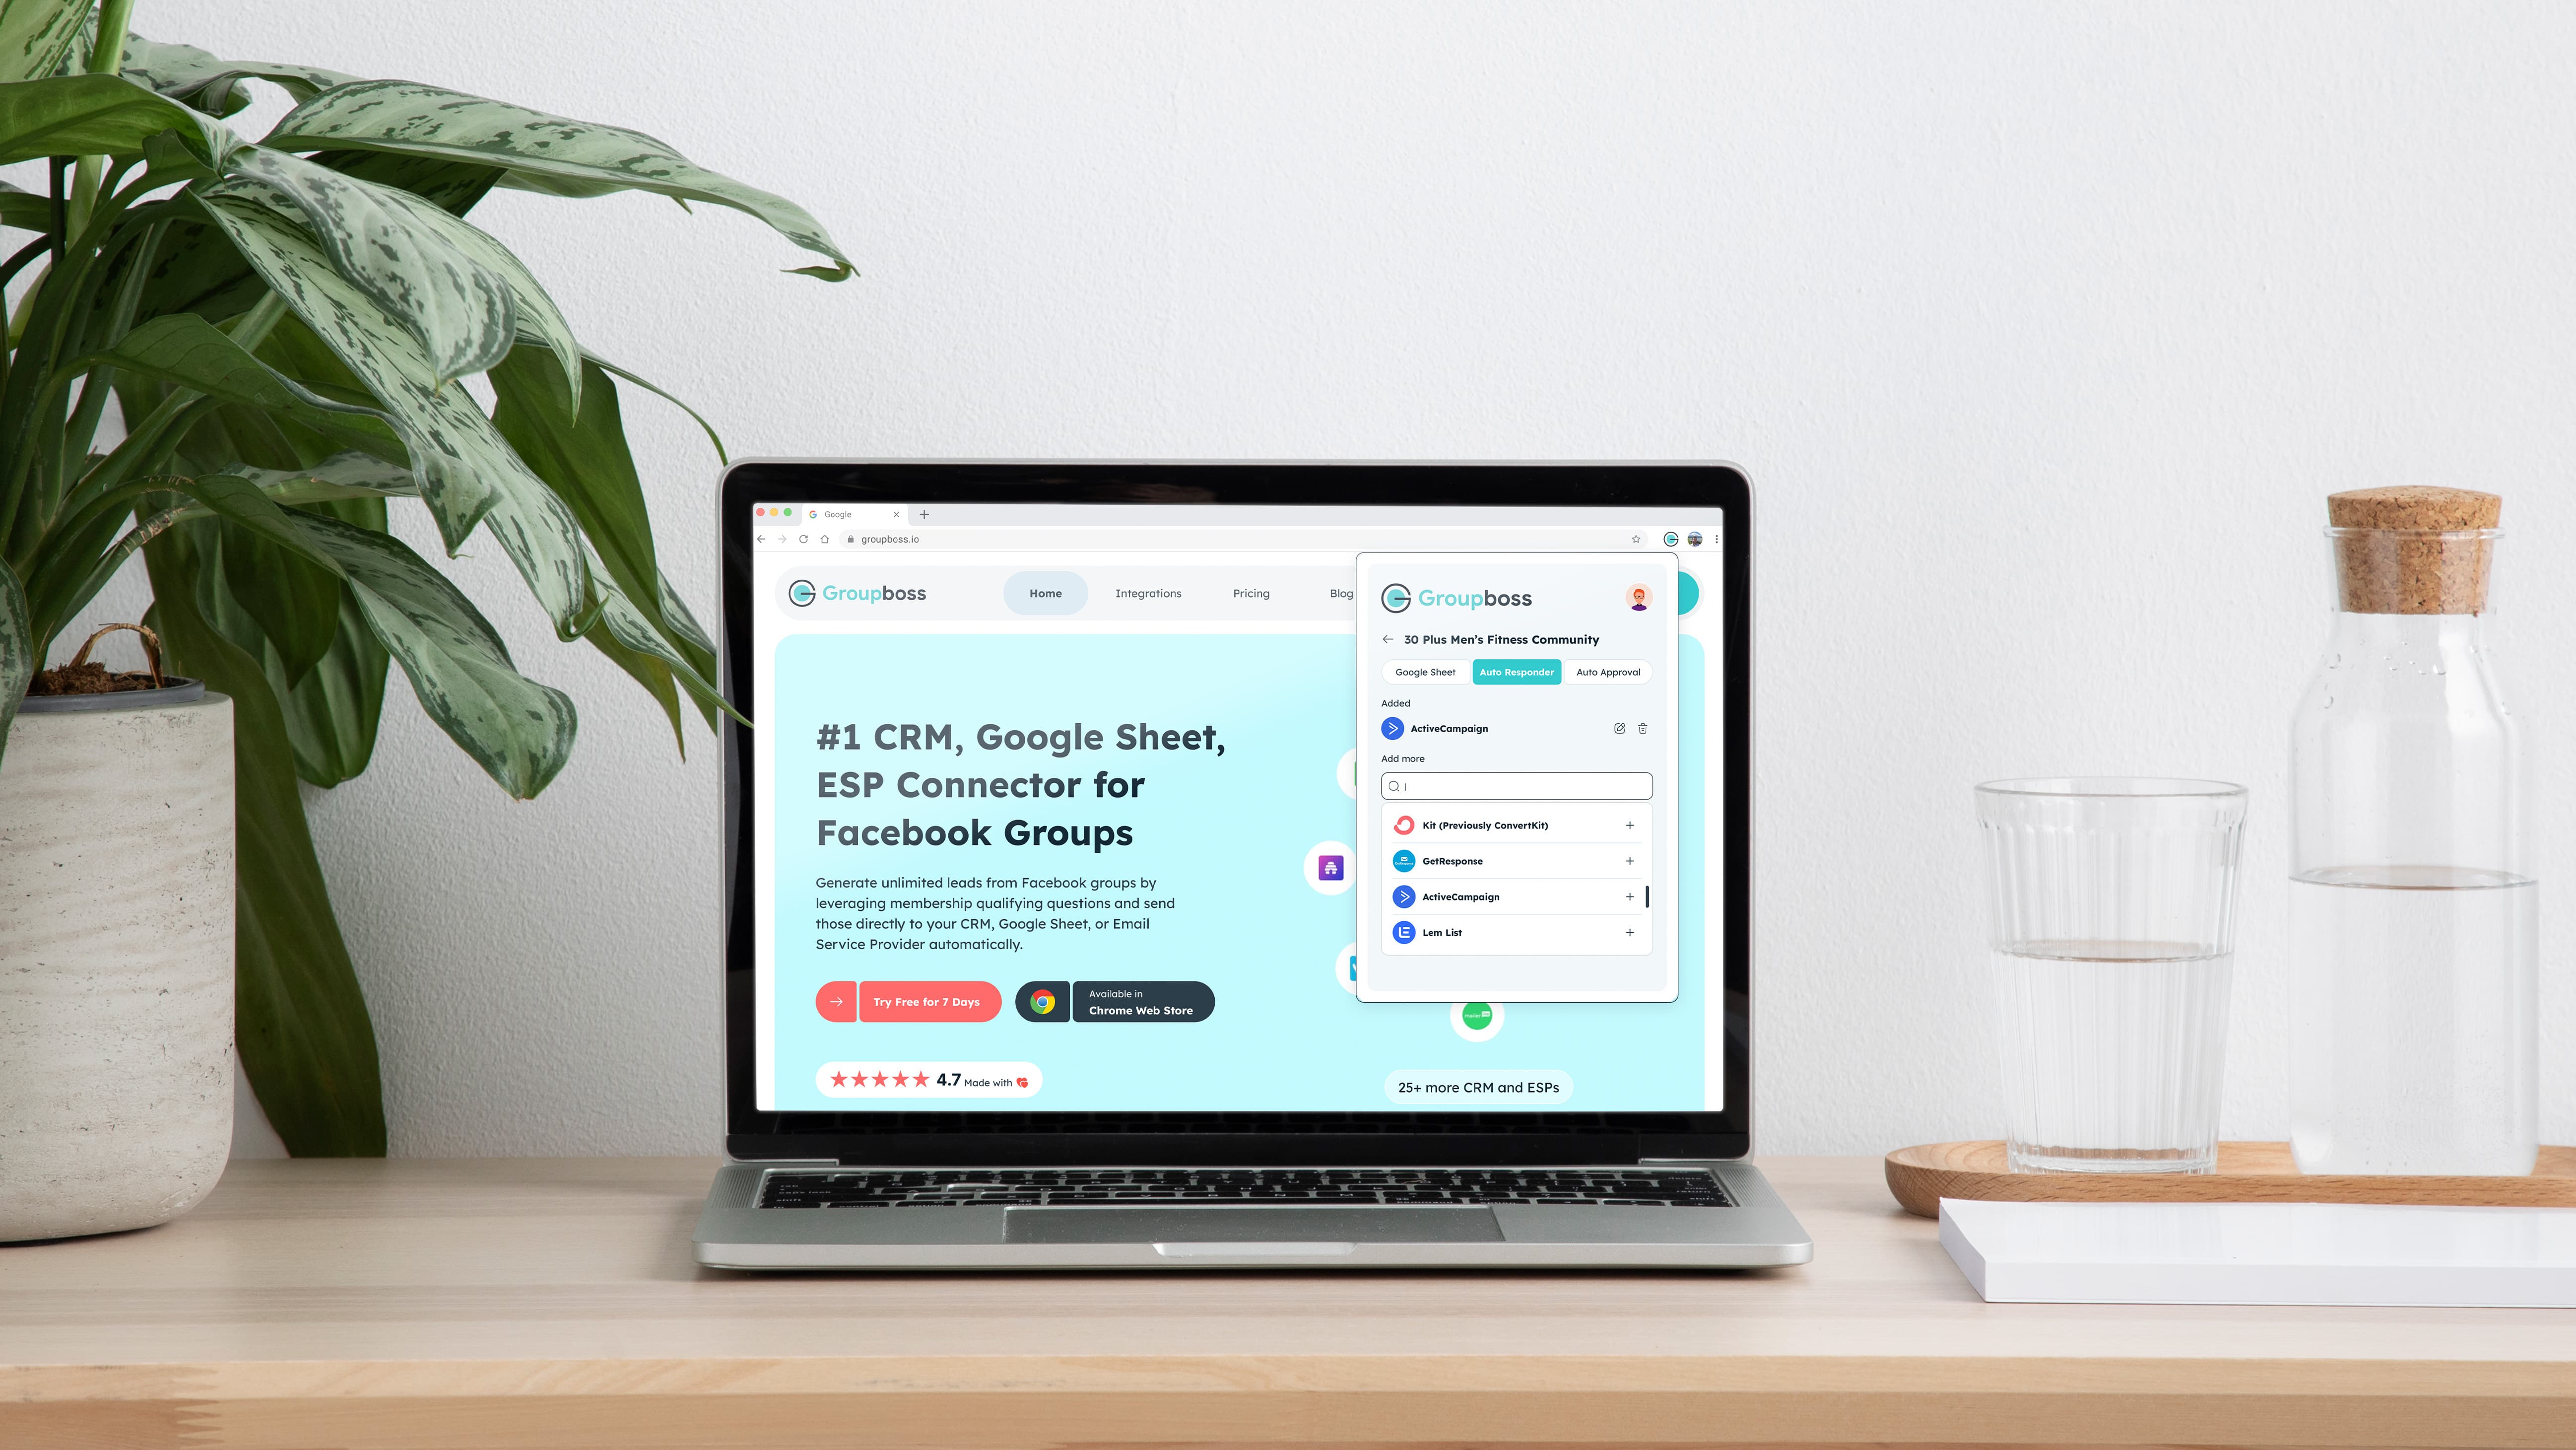
Groupboss Chrome Extension Redesign
Groupboss Chrome Extension Redesign
UI Rationale
UI Rationale
Lead Generation
Lead Generation
UI Design
UI Design
UX Laws
UX Laws
Read Case Study
Read Case Study

Apploye WebApp Feature Design
Apploye WebApp Feature Design
Feature Design
Feature Design
SaaS
SaaS
B2B
B2B
Report
Report
UX Process
UX Process
Read Case Study
Read Case Study
Let's build products people love to use
Let's build products people love to use
Whether you're improving an existing SaaS product, launching something new, or looking for your next Product Designer, I'd love to hear what you're working on.
Whether you're improving an existing SaaS product, launching something new, or looking for your next Product Designer, I'd love to hear what you're working on.
Whether you're improving an existing SaaS product, launching something new, or looking for your next Product Designer, I'd love to hear what you're working on.
Book a Call
Book a Call
Book a Call
e.rakib@gmail.com


e.rakib@gmail.com
e.rakib@gmail.com
e.rakib@gmail.com
Thanks for your time
Thanks for your time